Session 1: Why observability?
You have just inherited a marketplace that is already in production, with real customers placing orders every minute. The previous team left little documentation and almost no instrumentation. Over the next six sessions you will make this system observable, and use what you build to investigate incidents as they happen.
Today you get your bearings: what runs, where its data lands in Datadog, and how far you can trust what Datadog tells you.
What you hand in
Section titled “What you hand in”By the start of session 2:
- A merged merge request on your team’s repository (see Part 4).
- A Datadog Notebook named
Session 1: inventoryin your team’s organization (see Part 4).
Plan for the lab
Section titled “Plan for the lab”- Part 1Everyone is in
- Part 2Meet your marketplace
- Part 3A guided tour of Datadog
- Part 4Challenge: the inventory
- Part 5Bonus: logs and a ticketif you have time
Rotate who drives. By the end of the session, every member of the team should have run a Metrics Explorer query themselves.
Concepts you will use
Section titled “Concepts you will use”Tags. A tag is a key:value pair, such as service:catalog, attached to
every log line and metric point. You filter and group by tags, so most queries
you write start with one.
Facets. In the Log Explorer, the filters on the left are called facets. Think of a facet as a column and of tag values as what is in that column: you filter on it, group by it and count it.
Unified service tagging. Datadog links logs, metrics and traces through three reserved tags:
| Tag | Answers | In your stack |
|---|---|---|
service |
Which program produced this? | One per component, for example catalog |
env |
Which environment? | course for your deployed stack |
version |
Which build? | The Git commit your pipeline deployed |
Datadog shows data under whatever tags it arrives with; it never checks them.
On Kubernetes, the Datadog Agent reads these three tags from the
tags.datadoghq.com/service, tags.datadoghq.com/env and
tags.datadoghq.com/version labels of each pod. Your Helm charts set those
labels.
How data reaches your organization. One Datadog Agent runs on your team’s Kubernetes node. It already collects every container’s standard output as logs, and every container’s CPU, memory and network as metrics, and ships them to your team’s organization. No application code is instrumented yet. That part is your job over the next sessions.
catalogtags.datadoghq.com/service: catalogenv: courseversion: <commit>- reads the three labels as
service,env,version - adds tags from Kubernetes:
kube_namespace,kube_deployment,pod_name,container_name,host
Infrastructure tags. Besides the three tags above, the Agent adds tags
it discovers itself: kube_namespace, kube_deployment, pod_name,
container_name, host and more. These come from Kubernetes, not from your
charts.
catalog service listening{"level":"info","msg":"catalog service listening","addr":":8082"}- Your Helm chart (pod labels)
- Kubernetes
- The node the Agent runs on
catalog as Datadog stores it. Values are examples.Part 1: Everyone is in
Section titled “Part 1: Everyone is in”Each member of the team, on their own laptop:
-
Run the setup check. Fix any
FAILline now, or tell the instructor. -
Sign in to app.datadoghq.eu and check the organization name in the account menu is your team’s, on the EU1 site.
-
Open your team’s project on GitLab and find the latest pipeline on
main. -
If you have your kubeconfig:
Terminal window kubectl -n <team> get deploymentskubectl -n <team> get pods -o wide
Part 2: Meet your marketplace
Section titled “Part 2: Meet your marketplace”- Open your storefront (your team hostname, from the welcome email), sign in (or create an account), and buy something.
- Your order starts as pending. Refresh the order page until it changes.
- Using the Architecture section of the repository’s
README.md, write down which components your order went through, and in which order. Some of the work happened after the page answered you. Which part? - Make a list of every component your team runs: the services, the
workers, the proxy, the datastores. Scroll through
README.md, the directories underk8s/and, if you have it,kubectl get deployments. Keep this list; you need it in Part 4.
Part 3: A guided tour of Datadog
Section titled “Part 3: A guided tour of Datadog”Each step ends with questions. Write the answers down: they go in your Notebook later.
3.1 Infrastructure
Section titled “3.1 Infrastructure”- Infrastructure, Host Map. How many hosts does your organization see? Your stack runs on one dedicated node. Does that match?
- Infrastructure, Containers. Group by
kube_deployment.- Which container uses the most memory right now? The most CPU?
- Open one container and read its tags. Find
service,envandversion, and at least three infrastructure tags.
3.2 Metrics
Section titled “3.2 Metrics”Open Metrics, Explorer. A query is one row with three fields, read left
to right: the metric, then from (which data to keep), then how to
combine it, such as avg by or sum by followed by a tag (one line per
value of that tag). Always put your team’s namespace in from, for example
kube_namespace:t05: (everywhere) also shows the cluster’s own components.
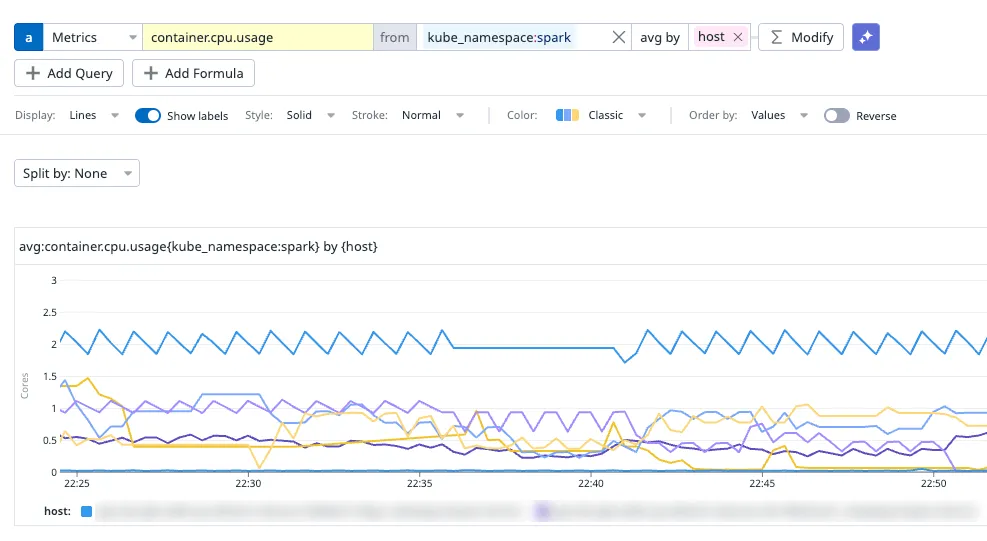
container.cpu.usagefromkube_namespace:<team>avg bykube_deployment. Which deployment uses the most CPU? Then the same withcontainer.memory.usage.kubernetes.containers.restartsfromkube_namespace:<team>sum bykube_deployment. Has anything restarted recently?- Open Metrics, Summary, the list of every metric your organization
receives, and search
container.. How many metrics does the Agent collect about containers? Pick one you did not know and find out what it measures. - Go back to the query from step 1 and change avg by from
kube_deploymenttoservice. Do both give you the same list of lines?
Grouped by kube_deployment, Postgres and Redis show up as N/A: they run as
StatefulSets, not Deployments. That is expected.
3.3 Where the tags come from
Section titled “3.3 Where the tags come from”- In your repository, open
k8s/catalog/templates/_helpers.tpland find thetags.datadoghq.com/*labels. Then find wheredeployment.yamluses them. - What will happen to every service’s
versionthe next time your team merges a merge request? Check your answer after Part 4.
Part 4: Challenge: the inventory
Section titled “Part 4: Challenge: the inventory”Before you instrument anything, you need to know whether you can trust what Datadog already shows you. You write this challenge up as a Notebook, the way you will write up every incident in this course. Read Incident write-ups before you start.
Start the Notebook. In Datadog, open Notebooks, New Notebook and name
it Session 1: inventory. Everything you find in this part goes into it.
Your task. Every component on your list from Part 2 should appear in
Datadog under its own service. Check it with queries, not by reading long
lists by eye:
-
In the Metrics Explorer, build two queries on the same metric. Each line of the result is one group, and its value is how many containers run in it:
- A:
kubernetes.containers.runningfromkube_namespace:<team>sum bykube_deployment - B:
kubernetes.containers.runningfromkube_namespace:<team>sum byservice
- A:
-
Compare A, B and your Part 2 list. Does every deployment have a
serviceof the same name? Does aservicecount more containers than any single deployment? -
When something does not add up, build a query whose result is the problem: for example a value of
0where Kubernetes says1. A query with no data shows nothing at all; the default zero function (in the query’s function menu) turns that into a0you can point at. Save this query to your Notebook as Evidence.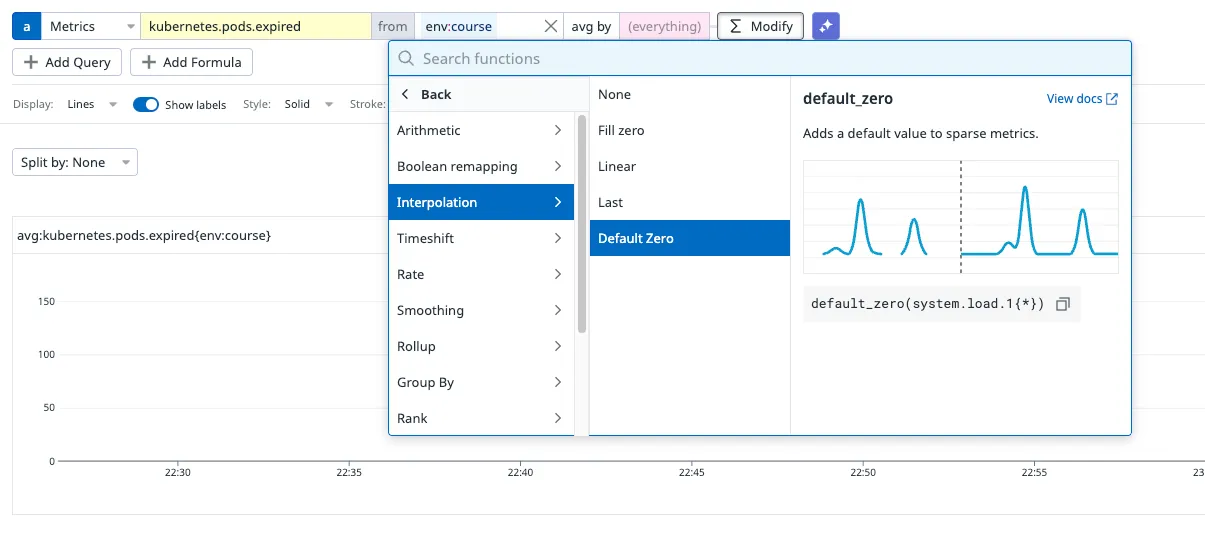
-
Find out why, and fix it the way your team will fix everything from now on. Then show the same query after the deploy as Verification.
Rules
- Every change goes through a merge request on your team’s repository.
Nobody can push to
main, and a merge request only merges when its pipeline passes. A merge tomaindeploys your stack. - Investigate with Datadog first, and only then go to the code: the point is to learn what the tooling shows you, not to read the repository line by line.
- Data Datadog has already ingested keeps the tags it arrived with. Only data sent after your deployment shows the change.
You
- BranchCommit your change on a branch.
- Merge requestOpen it against main. Nobody can push to main.
Pipeline, before merge
- Checksgofmt, go vet, golangci-lint, build, Go tests, helm lint.A failed check blocks the merge.
- MergePossible only once the pipeline has passed.
Pipeline, after merge
- Build imagesOne image per service, tagged with the commit.
- Deployhelm upgrade --atomic, chart by chart, into your namespace.A failed deploy rolls back.
- RunningNew pods replace the old ones.
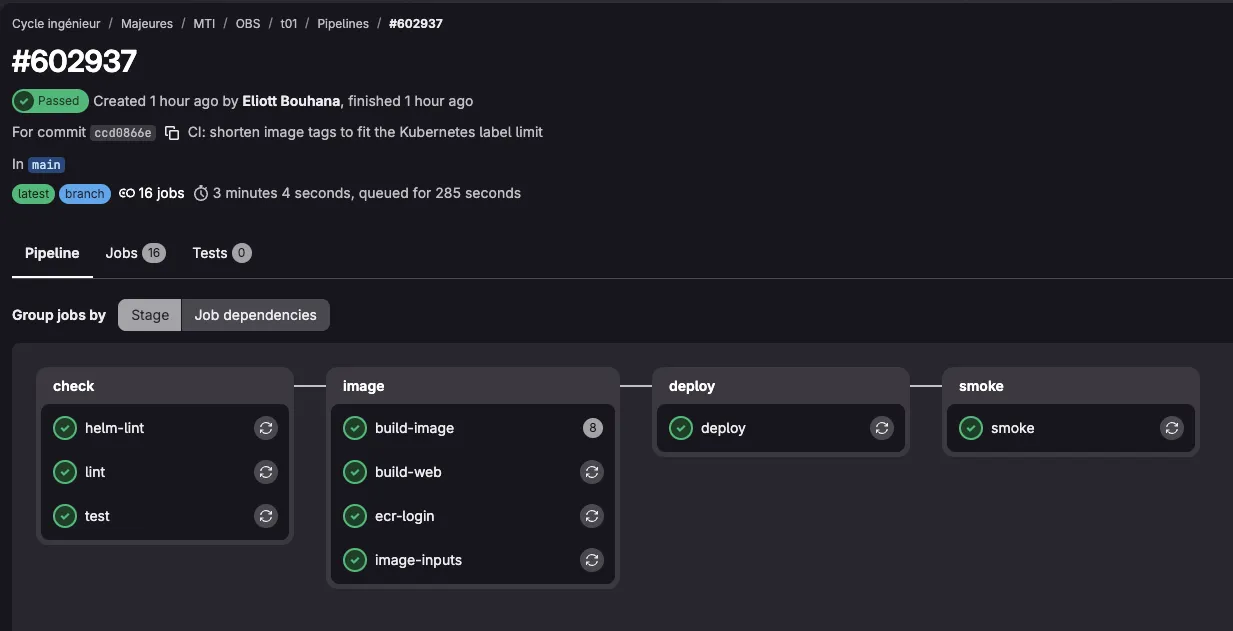
Freeze the moment of the fix. Give your Evidence and Verification cells a fixed time frame, from a little before your merge to a little after the deploy, as described in Fixing a cell’s time frame. The pipeline in GitLab shows when the deploy ran: open it from the merge request or from Build, Pipelines.
Your Notebook follows the structure every write-up in this course uses:
Investigate
- 1SymptomWhat looked wrong, in one or two sentences.
- 2HypothesisWhat you think causes it, and how you would confirm it.
- 3EvidenceA log query, a metric graph: what confirms or refutes it.live cell
Fix
- 4ActionWhat you changed.MR link
Prove
- 5VerificationThe system after your deploy.live cell
- 6ConclusionThe cause in one sentence, naming the component and the setting.
Part 5: Bonus
Section titled “Part 5: Bonus”Finished Part 4 early? Start on these. They lead into session 2.
5.1 A tour of the logs
Section titled “5.1 A tour of the logs”Open Logs, Explorer, last 15 minutes.
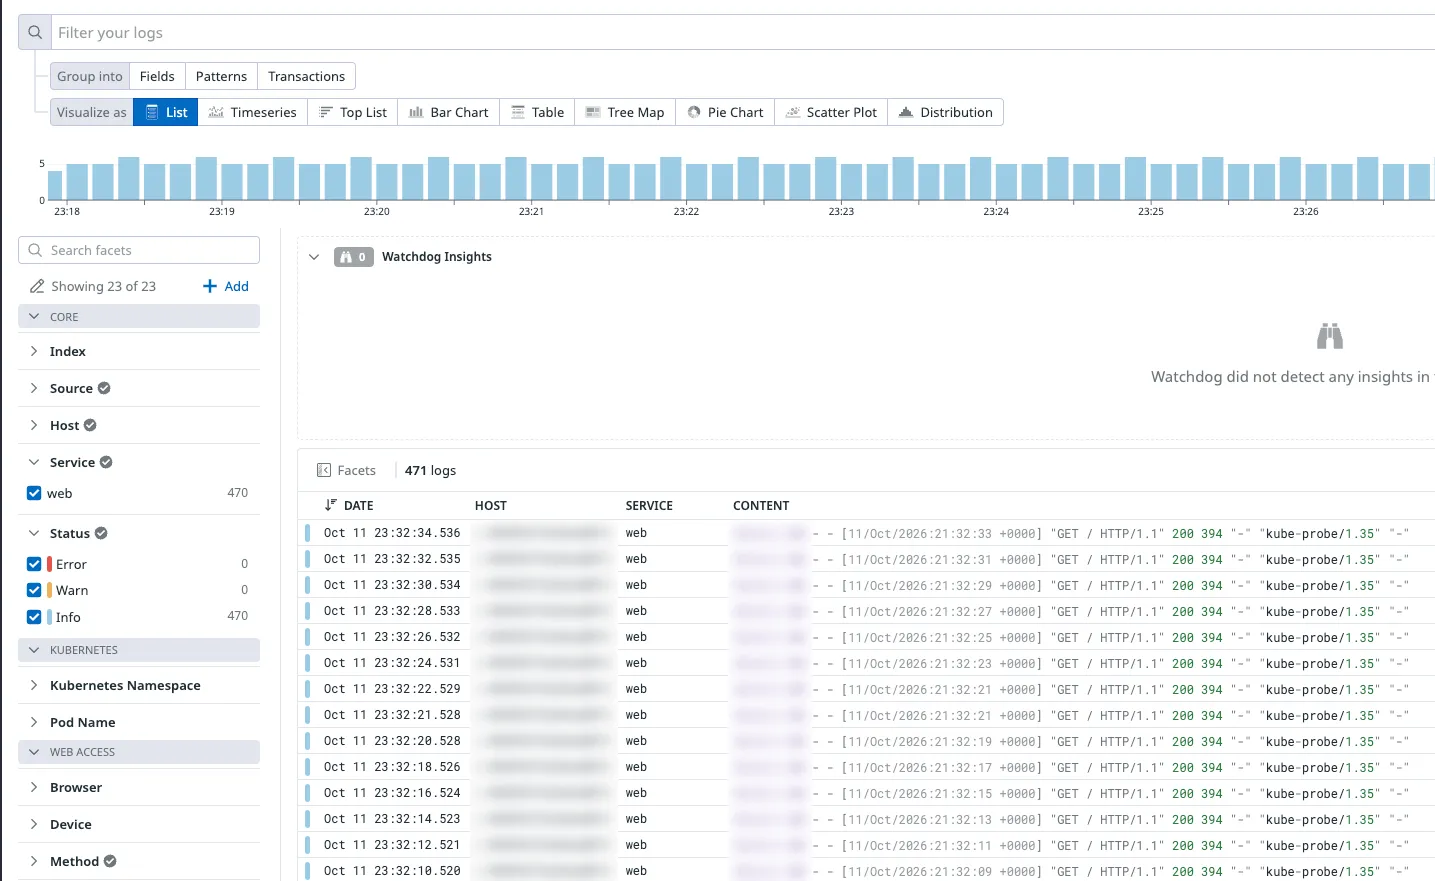
- On the left of the page is a list of filters, one per tag: Service, Host, Status and more. Datadog calls them facets. Open Service: it lists every service that sent logs, with a count. Which service writes the most log lines?
- Under Visualize as, switch from List to Timeseries, a graph of how
many lines arrive over time. Group it by
serviceto get one line per service. Does the log volume of each service look steady, or does something burst? - Pick one line and open it. Find each tag from the diagram in Concepts and check its value. Which of them would change if the pod restarted? Which would change if your team deployed a new commit?
- Reload a product page in your browser, then find the log line that page load produced. Search for its path as free text. Now try to find a log line for the order you placed in Part 2. What does it tell you that only some events are logged?
- Open Live Tail, which shows log lines as they arrive, for a minute. Roughly how many lines per second reach your organization, and from which services?
- Compare a line from
webwith a line fromcatalog. Which one could you filter on by field, and which one is just text? You will fix that in session 2.
5.2 A support ticket
Section titled “5.2 A support ticket”A ticket from the merchandising team, who own the product catalog:
A customer says the Amazon Echo Show 10 has looked broken in the shop for a while. Everything else is fine. The catalog is ours, so don’t change anything: tell us what is wrong and we will fix it.
Write your diagnosis in a second Notebook, Session 1: bonus. Fill in
Symptom, Hypothesis, Evidence and Conclusion. There is nothing to
fix, so this one has no Action and no Verification. The Conclusion
also explains why nothing in your stack reports an error.
Before session 2
Section titled “Before session 2”- Your inventory merge request is merged, and its pipeline deployed.
-
Session 1: inventoryholds every section with live evidence. - Every member can sign in to Datadog and GitLab, and has run a Metrics Explorer query.
- Session 2 is about logs. Look at one raw log line from three different services and decide, for each, how you would search for every request that failed.