EPITA · 2026
Observability 101
Session 1: Why observability?

Warm-up · no wrong answers
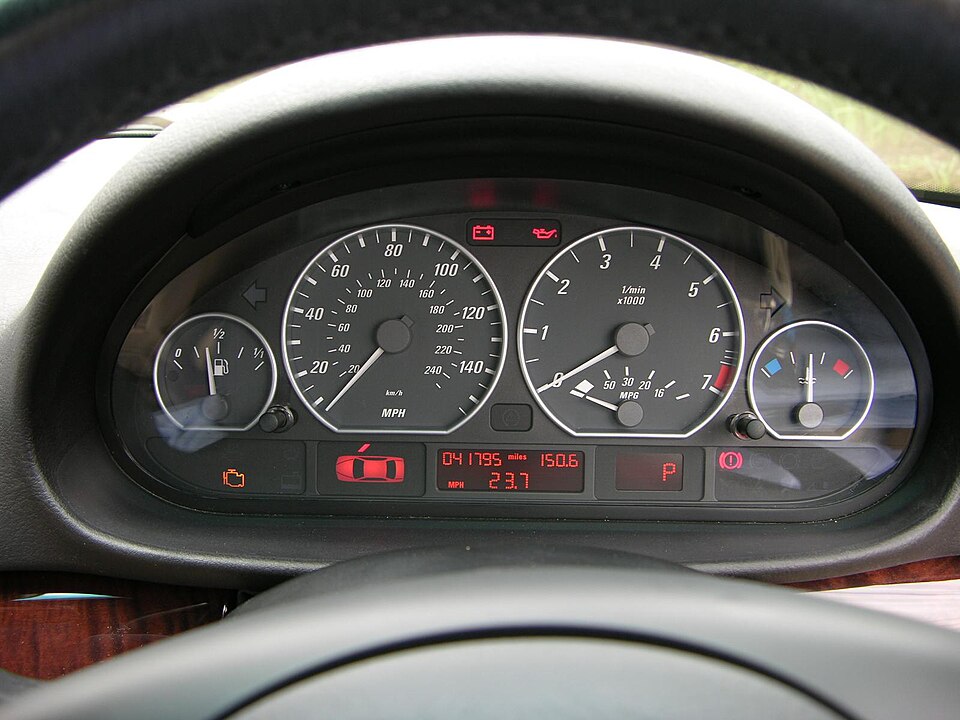
What do you think observability is?
01
What is observability?
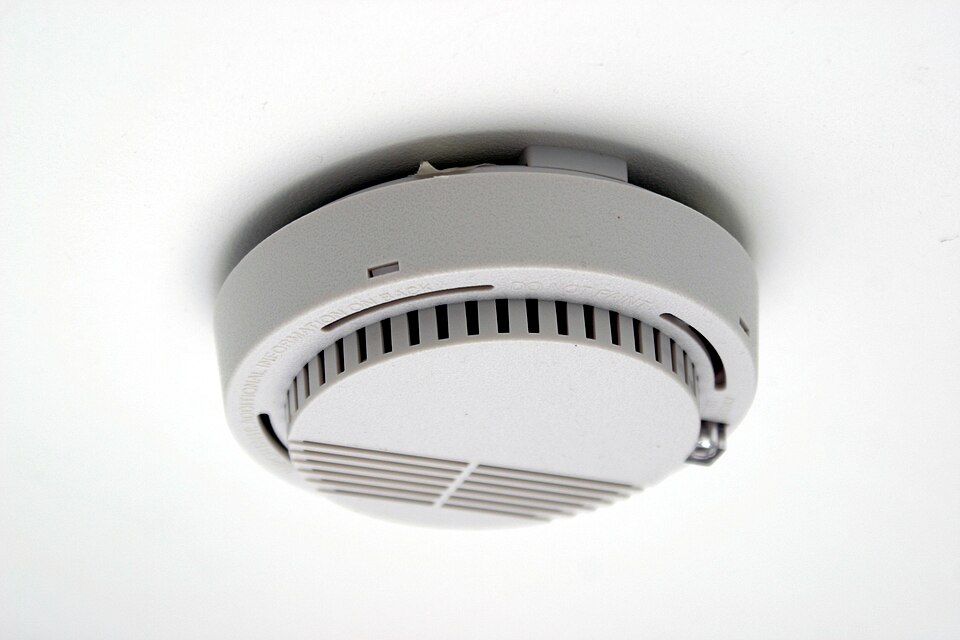
02
How is it different from “monitoring”?
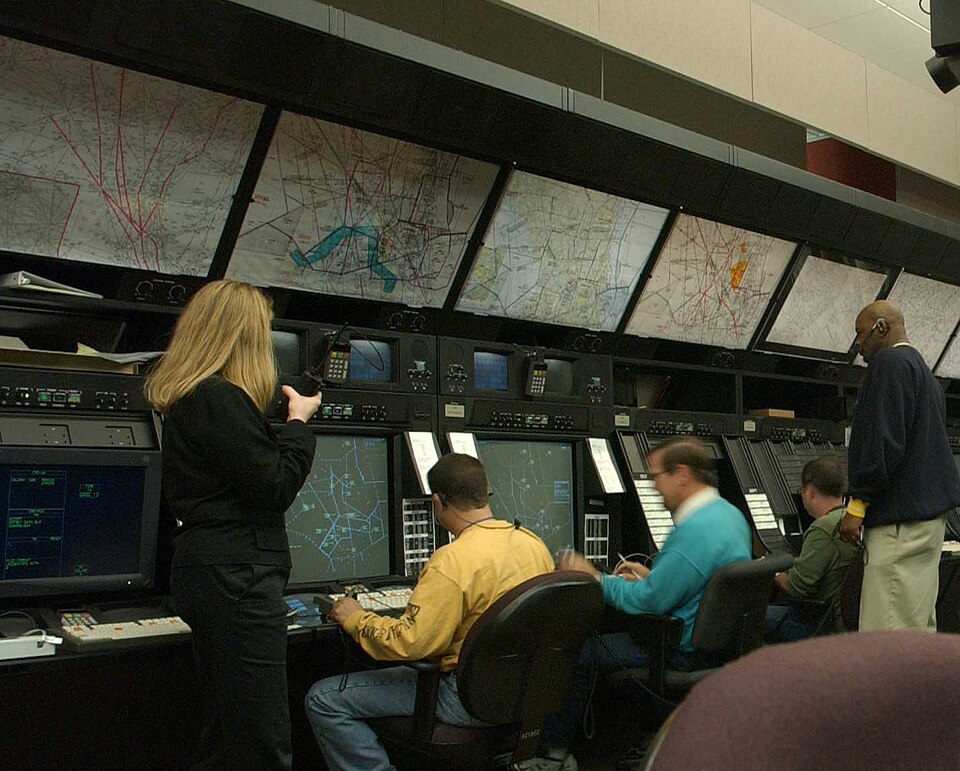
03
What is it for? Who uses it, and when?
2
The course in one picture
1
Setup
Why observability?
Today
2
Logs
Your first line of defense
3
Metrics
Measuring what matters
4
Traces
Following the request
5
Connect
Dashboards, SLOs and alerting
6
Incident
The real deal
3
Your instructors

Eliott
Software Engineer @ Datadog
Open-source Go instrumentation. Securing customers applications and Kubernetes clusters.
EPITA promo
2023
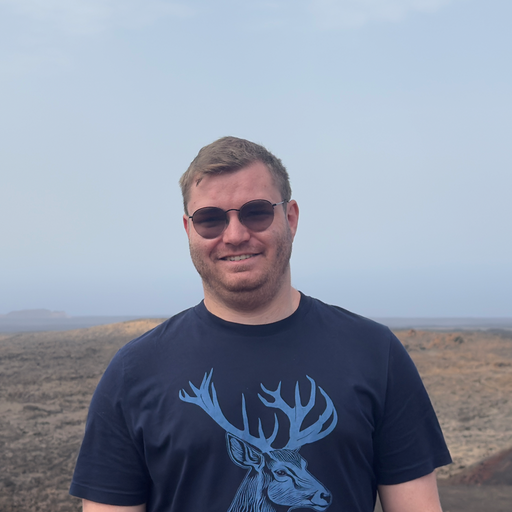
Thomas
Software Engineer @ Datadog
Infrastructure. Owns all of Datadog's Envoy proxies, including the ones ingesting all customer traffic: logs, metrics, traces.
EPITA promo
2024
4
Disclaimer
Why Datadog?
It is where we work and what we know best. And each group gets a full Datadog organization, for free.
The instrumentation you write uses OpenTelemetry, which is vendor-neutral.
The concepts are the point. The tool is interchangeable.
Open source
Datadog
Instrumentation
OpenTelemetry
OpenTelemetry
Logs
Loki or OpenSearch
Log Management
Metrics
Prometheus
Metrics
Traces
Jaeger or Tempo
APM
Dashboards
Grafana
Dashboards
5
Disclaimer · about AI
Leave the AI assistant closed in this course.
The goal is to learn to investigate a system, not to watch a tool do it.
Debugging intuition comes from digging yourself: a hypothesis, being wrong, finding the evidence.
During an incident, the person who understands the system is the one who fixes it.

6
Warm-up · no wrong answers
What do you think observability is?
01
What is observability?
02
How is it different from “monitoring”?
03
What is it for? Who uses it, and when?
7
03:07
It's 3 a.m. Checkout is failing.
Where do you look?
!
Pager · P1now
[Triggered] checkout endpoint 500 rate above 25%
service:checkout · env:prod · you are on call
Checkout error rate
38%
02:3002:4503:0003:07
8
Monitoring vs observability
Monitoring
Answers questions you thought of in advance. Known unknowns.
“Is the CPU above 90%?”
“Is the error rate above 5%?”
Observability
Lets you ask new questions from the outside, without shipping new code. Unknown unknowns.
“Why are only big baskets failing, and only for some users?”
Monitoring tells you that something is wrong. Observability helps you find out why.
9
Why it matters now: one request, many services
In a monolith, a request lives in one process: a stack trace or a log file is enough. In a distributed system, it crosses many.
One paid checkout on your stack
67
calls in
a single trace
a single trace
7
services
8
Postgres queries
3
Redis calls
POST /checkout · trace waterfall
edge-proxy
cart
authenticator
redis
catalog
stock
postgres
billing
cart-worker
10
The three pillars, at a glance
Logs
What happened, event by event.
{
"timestamp": "03:07:12.481Z",
"level": "error",
"service": "billing",
"message": "payment timeout"
}
"timestamp": "03:07:12.481Z",
"level": "error",
"service": "billing",
"message": "payment timeout"
}
Session 2
Metrics
How much and how often, over time.
p95 latency, ms
Session 3
Traces
Where the time went, across services, for one request.
proxy
cart
stock
billing
Session 4
11
How the pillars connect
On their own, they are three disconnected views. Shared tags tie them together: the unified service tags.
serviceenvversion
01 · METRIC
A latency spike on one service
filter by service, env
→
02 · LOGS
That service's logs, at that minute
same service, env, version
→
03 · TRACE
The trace of one slow request
same service, env, version
The tool never checks your tags. A wrong tag is not an error: the data just lands in the wrong place.
12
Pause · the theory
Questions?
Monitoring vs observability, microservices, the three pillars and how they connect.
13
WAR STORY 1 OF 3 · 1 AUGUST 2012
Knight Capital
$440M
lost in roughly 45 minutes
A deployment missed one of eight servers, which ran old, dormant trading code. Automated emails flagging an error went out before the market opened. Nobody acted on them.
After an incident, observability is how you write the post-mortem and size the damage.
14
War story 2 of 3 · 2 July 2019
Cloudflare
27 MIN
of errors on Cloudflare-proxied sites, worldwide
A single WAF rule with a badly backtracking regular expression was deployed globally. CPU hit 100% on every machine serving HTTP traffic.
In a real incident you get one shot. Every wrong guess costs time and money.
15
WAR STORY 3 OF 3 · 28 FEBRUARY 2017
AWS S3, us-east-1
4 HOURS
of S3 disruption in the region, taking a large part of the web with it
An engineer mistyped an input while removing a few servers, and removed far more. AWS's own status dashboard depended on S3, so it could not show the outage.
Set up observability before the incident. Without it, you are blind when it matters.
16
AWS · Cloudflare · Knight Capital
Before, during and after an incident, the question is not “is it broken?” but “why, and where?”
17
What observability is for, beyond outages
01Find the root cause fasterLower your mean time to resolution (MTTR).
02Know the blast radiusWho is affected, and how badly?
03Confirm a fix workedEvidence, not hope.
04Catch problems earlyBefore your users do.
05Understand a system you did not writeThat is exactly your situation, from today.
18
Back to the warm-up
So, what is observability?
01
What is observability?
Today: asking new questions about your system from the outside, without shipping new code.
02
How is it different from “monitoring”?
Today: monitoring tells you that something is wrong. Observability helps you find out why.
03
What is it for? Who uses it, and when?
Today: Everybody having a question on their system. From engineers running incidents to CEOs marketing KPIs
19
Pause · end of the lecture
Questions?
Anything from the war stories, or about observability in general.
20
The lab starts here
21
Today's lab
The stack you inherit
Your group inherits a small marketplace already in production, with customers placing orders every minute.
The previous team left almost no documentation and almost no instrumentation.
Over six sessions, you make it observable.
Edge
storefrontenvoy
Go services
authenticationcatalogstockcartbilling
Data
postgresredis
External
payment provider
Things will break along the way. Investigating what broke is part of the job.
22
Today's lab
How data gets there
01
Your application
Emits logs, metrics and traces.
→
02
Agent on the node
Collects all three, adds host context, ships them.
→
03
Observability backend
Stores, indexes and correlates.
→
04
What you use
Dashboards, monitors and notebooks.
23
Today's lab
How it works and how you are graded
Groups of 4. Each group has its own deployed copy of the stack and its own Datadog organization.
Theory and hands-on, every session, on your own stack.
Work carries over. What you start in a session, you finish with your group before the next one.
Every investigation is a Datadog Notebook in six sections. Evidence and verification are live queries, never screenshots.
SymptomHypothesisEvidenceActionVerificationConclusion
Every fix goes through a merge request.
Grading
All group work
Final incident response
Session 6
Session 6
50%
Incident investigations
Sessions 2 to 5
Sessions 2 to 5
30%
Instrumentation quality
Sessions 2 to 5
Sessions 2 to 5
20%
24
Today's lab
Get your bearings
01
Sign in
To your team's Datadog organization.
02
Meet your marketplace
The services you just inherited.
03
See what already flows in
And what is missing.
04
Question the data
How far can you trust what the tool tells you?
Hand-in
Before session 2
A merged merge request
A Datadog Notebook named “Session 1: inventory”
25
Today's lab
Questions?
The stack, the notebooks, the grading, or today’s lab. We are around during the whole session.
26